Benchmarking Java Virtual Thread Performance
Virtual thread is set to be released in JDK 21. This feature will bring significant benefits to many IO-bound frameworks. It will alleviate the burden on Java developers like me from having to write reactive-style code. The following tests have been conducted using JDK 21 EA build 25. CPU: Ryzen 4800H mobile.
JVM Memory and Startup Time
Java is presumed to consume more memory in general. Lets see how much memory a hello world program uses and explore how it grows by adding dependencies.
public static void main(String[] args) throws Exception {
    System.out.println("hello world");
    Thread.sleep(Duration.ofSeconds(100));
}
The maximum resident set size (RSS) memory used is measured at 44104 or approximately 44MB. This result is not bad, as I anticipated a higher value. However, let us now examine the actual heap usage.
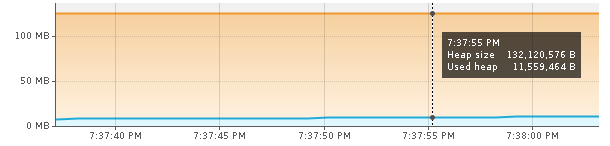
Upon starting Visual VM, the JVM immediately spawns multiple threads to facilitate the recording and monitoring of its memory usage. Consequently, this results in an increased resident set size (RSS) of 117MB. However, it is worth noting that the heap usage remains relatively low, at approximately 11MB. Now, let us proceed to limit the memory usage and observe how low we can potentially reduce the RSS.
java -Xmx15m -Xms15m -jar target/jarfilename.jar
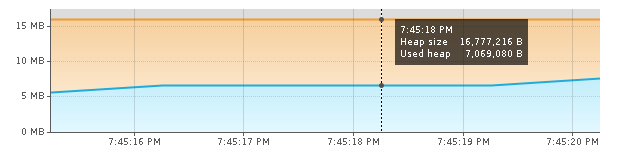
The resident set size (RSS) is measured at 41420 or 41MB, which appears to be the minimum memory usage of the JVM. Surprisingly, the heap usage is a mere 7MB.
I also attempted to time the "Hello World" program without any sleep. It took approximately 41ms to complete, indicating that the JVM startup time is at most 41ms.
$ time ~/jdk-21/bin/java -Xmx15m -Xms15m -jar target/jarfile.jar
hello world

real    0m0.042s
user    0m0.031s
sys     0m0.021s
Benchmarking Tomcat Server
So far, the JVM has been performing well. Now, let's examine its performance in serving HTTP requests. For this test, we have selected Tomcat 11-M7 embedded. This particular version offers an option to utilize virtual threads, which can be configured either in the server.xml file or programmatically within the embedded Tomcat. The Maven dependency for this setup is:
<dependency>
    <groupId>org.apache.tomcat.embed</groupId>
    <artifactId>tomcat-embed-core</artifactId>
    <version>11.0.0-M7</version>
</dependency>
Hello World Servlet
This code is a straightforward HTTP servlet that sends a "Hello World" response.
package blog.rasvi.io.tomcat.vte;

import jakarta.servlet.ServletException;
import jakarta.servlet.http.HttpServlet;
import jakarta.servlet.http.HttpServletRequest;
import jakarta.servlet.http.HttpServletResponse;
import java.io.File;
import java.io.IOException;
import org.apache.catalina.connector.Connector;
import org.apache.catalina.startup.Tomcat;
import org.apache.coyote.http11.Http11NioProtocol;
import org.apache.tomcat.util.net.NioEndpoint;

public class TempRunner {

    public static void main(String args[]) throws Exception {
        Tomcat tomcat = new Tomcat();
        var endPoint = new NioEndpoint();
        endPoint.setPort(8080);
        var connector = new Connector(new Http11NioProtocol(endPoint));
        tomcat.setConnector(connector);
        var ctx = tomcat.addContext("", new File(".")
                .getAbsolutePath());
        Tomcat.addServlet(ctx, "Servlet", new HttpServlet() {
            @Override
            protected void doGet(HttpServletRequest req, HttpServletResponse resp)
                    throws ServletException, IOException {
                try (var writer = resp.getWriter()) {
                    writer.println("Hello world!");
                } catch (Exception ex) {
                    throw ex;
                }
            }

        });
        ctx.addServletMappingDecoded("/*", "Servlet");
        tomcat.start();
        tomcat.getServer().await();
    }
}
Please note that I utilized the NIO endpoint instead of NIO2. It is important to mention that NIO2 does not dispatch requests within virtual threads.
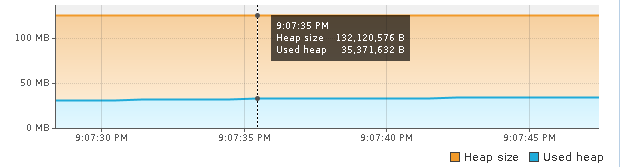
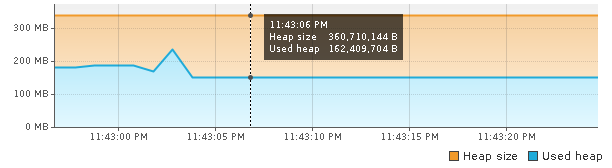
The heap usage is ~35MB, since the heap usage is very low, lets limit to 50MB with Xmx50m
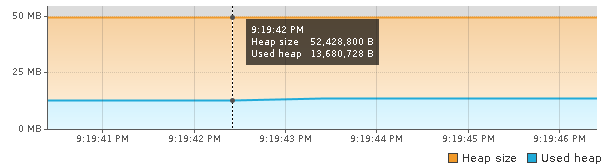
This usage is stable. The spikes in the graph are due to running benchmark. Adding below.
$ ab -k -n 100000 -c 100 http://127.0.0.1:8080/
This is ApacheBench, Version 2.3 <$Revision: 1879490 $>
Copyright 1996 Adam Twiss, Zeus Technology Ltd, http://www.zeustech.net/
Licensed to The Apache Software Foundation, http://www.apache.org/

Benchmarking 127.0.0.1 (be patient)
Server Software:
Server Hostname:        127.0.0.1
Server Port:            8080

Document Path:          /
Document Length:        13 bytes

Concurrency Level:      100
Time taken for tests:   0.605 seconds
Complete requests:      100000
Failed requests:        0
Keep-Alive requests:    99041
Total transferred:      13472189 bytes
HTML transferred:       1300000 bytes
Requests per second:    165298.27 [#/sec] (mean)
Time per request:       0.605 [ms] (mean)
Time per request:       0.006 [ms] (mean, across all concurrent requests)
Transfer rate:          21747.36 [Kbytes/sec] received

Connection Times (ms)
                min  mean[+/-sd] median   max
Connect:        0    0   0.1      0       2
Processing:     0    1   0.5      0       6
Waiting:        0    1   0.5      0       6
Total:          0    1   0.5      0       6

Percentage of the requests served within a certain time (ms)
    50%      0
    66%      1
    75%      1
    80%      1
    90%      1
    95%      1
    98%      3
    99%      3
    100%      6 (longest request)
Disclaimer: No new threads were created during this test :). The benchmark sends 100k requests with a concurrency level set to 100. It is truly remarkable to observe that 100k requests are sent within 0.6 seconds, resulting in a request per second (req/s) rate of 165k. Furthermore, these operations are accomplished with a mere 35MB of heap usage. The resident set size (RSS) is recorded at 180MB. Let us proceed to benchmark this scenario once again using wrk.
100 Connections, -Xmx50m
$ wrk -t 4 -d 100 -c 100 -d 10 http://127.0.0.1:8080/
Running 10s test @ http://127.0.0.1:8080/
4 threads and 100 connections
Thread Stats   Avg      Stdev     Max   +/- Stdev
    Latency   365.46us  394.67us  10.26ms   89.73%
    Req/Sec    82.12k     7.30k  135.75k    79.65%
3292508 requests in 10.10s, 273.77MB read
Requests/sec: 326002.77
Transfer/sec:     27.11MB
326K req/s is really good. Another test was conducted with 1000 concurrent connections using a maximum heap size (-Xmx) of 50m.
1000 Connections, -Xmx50m
$ wrk -t 20 -d 100 -c 1000 -d 10 http://127.0.0.1:8080/
Running 10s test @ http://127.0.0.1:8080/
20 threads and 1000 connections
Thread Stats   Avg      Stdev     Max   +/- Stdev
    Latency     4.28ms    5.48ms 313.56ms   98.91%
    Req/Sec    11.79k     2.92k   50.05k    92.49%
2318520 requests in 10.07s, 192.78MB read
Requests/sec: 230252.83
Transfer/sec:     19.14MB
It is remarkable that this does not utilize more memory. The resident set size (RSS) remains at 180M, even with 1000 concurrent requests. It appears that virtual threads, in the end, do not consume a significant amount of memory.
1000 Connections, no -Xmx
Benchmarking 1000 connections without -Xmx below:
$ wrk -t 20 -c 1000 -d 10s --timeout 5s http://127.0.0.1:8080/
Running 10s test @ http://127.0.0.1:8080/
20 threads and 1000 connections
Thread Stats   Avg      Stdev     Max   +/- Stdev
    Latency     2.52ms    1.77ms  48.43ms   79.97%
    Req/Sec    21.00k     6.63k  156.35k    95.87%
4206219 requests in 10.05s, 349.74MB read
Requests/sec: 418733.75
Transfer/sec:     34.82MB
RSS at 600M and heap is at 300/400MB. This suddenly is not impressive. 300M for 1000 requests means 3GB for 10k requests and 7.5GB for 25K requests approximately. :(
25k Connections (failure)
Dispatching 1000 threads does not result in a memory usage of 1000MB. However, let us push the boundaries even further by testing with 25,000 concurrent requests.
$ wrk -t 20 -d 100 -c 25000 -d 2s http://127.0.0.1:8080/
    unable to create thread 6: Too many open files
25k Connections - tomcat
🤦 I had to fight with TCP/IP stack of linux to run this test. In addition to tweaking kernel parameters, the tomcat connector is configured to handle high concurrency.
var endPoint = new NioEndpoint();
endPoint.setMaxConnections(100_000);
endPoint.setMaxThreads(100_000);
endPoint.setMaxKeepAliveRequests(100_000);
endPoint.setAcceptCount(100_000);
endPoint.setPort(8080);
endPoint.setUseVirtualThreads(true);
var connector = new Connector(new Http11NioProtocol(endPoint));
$ wrk -t 20 -c 25000 -d 10s --timeout 15s http://127.0.0.1:8080/
Running 10s test @ http://127.0.0.1:8080/
20 threads and 25000 connections
Thread Stats   Avg      Stdev     Max   +/- Stdev
    Latency   346.99ms  812.16ms   5.54s    89.58%
    Req/Sec    26.95k    17.66k   53.92k    49.73%
5043788 requests in 10.09s, 418.48MB read
Requests/sec: 499724.27
Transfer/sec:     41.46MB
The benchmark executed successfully, with the resident set size (RSS) reaching 2350MB and the heap reaching 2112MB. These values are considered decent for 25k concurrent connections, although not as high as the anticipated 7.5GB. It is important to note that we are discussing actual HTTP connections here, which involve more than just spinning off multiple threads.
25k Connections, 10s sleep - tomcat
Adding a sleep before writing response, because you know we use virtual threads. This test is to hold 25k connections for 10 seconds.
Thread.sleep(Duration.ofSeconds(10));
writer.println("Hello world!");
$ wrk -t 25 -c 25000 -d 15s --timeout 15s http://127.0.0.1:8080/
Running 15s test @ http://127.0.0.1:8080/
25 threads and 25000 connections
Thread Stats   Avg      Stdev     Max   +/- Stdev
    Latency    11.51s   517.08ms  12.31s    68.52%
    Req/Sec     1.34k     1.42k    9.59k    88.89%
25000 requests in 15.08s, 2.07MB read
Requests/sec:   1658.35
Transfer/sec:    140.90KB
When blocking 25k connections, the resident set size (RSS) eventually reaches 3.8GB, while the heap size reaches 3.2GB. The req/s doesn't matter much as most of the time the server only waits in sleep. In a practical scenario it would be waiting for database or signal from another service. An example scenario is to send live score of a sport to 25k users. When live score is updated all 25k waiting connections will be sent the current live score. The memory usage is is really good, but how good is this? One of the most memory efficient and safe language is Rust. Let's compare with it just because of curiosity.
Rust Axum
The rust example uses axum framework with a similar hello world request handler. The program is built with --release flag and the version is 1.70.0.
use axum::{routing::get, Router};
use std::net::SocketAddr;
use tokio::time::{sleep, Duration};

#[tokio::main]
async fn main() {
    // build our application with a route
    let app = Router::new().route("/", get(root));

    // run our app with hyper
    // `axum::Server` is a re-export of `hyper::Server`
    let addr = SocketAddr::from(([127, 0, 0, 1], 3000));
    axum::Server::bind(&addr)
        .serve(app.into_make_service())
        .await
        .unwrap();
}

// basic handler that responds with a static string
async fn root() -> &'static str {
    sleep(Duration::from_secs(10)).await;
    "Hello, World!"
}
It seems that there is no straightforward method to limit the number of concurrent connections within the framework. I speculate that the framework has a restriction on the number of streams per HTTP/2 connection, resulting in the failure of the wrk benchmark to send 25k requests. To address this issue, I increased the number of threads in wrk as a workaround. This approach assumes that in wrk, each thread establishes a new connection, thereby reducing the number of streams per connection.
25k Connections with sleep for 10s - Rust Axum
$ wrk -t 500 -c 25000 -d 15s --timeout 15s http://127.0.0.1:3000/
Running 15s test @ http://127.0.0.1:3000/
500 threads and 25000 connections
Thread Stats   Avg      Stdev     Max   +/- Stdev
    Latency    10.00s   470.99us  10.00s    65.14%
    Req/Sec     4.00      0.00     4.00    100.00%
25000 requests in 15.10s, 3.10MB read
Requests/sec:   1655.39
Transfer/sec:    210.16KB
At the end, RSS usage of the rust program is at 537MB. Compared to Java's 3.8GB Rust is 7 times more memory efficient. I would say it is not bad.
Vert.x Web
Let's go even further by switching the java server. I have a feeling tomcat uses more memory per request. Let's try vert.x web. I use smallrye mutiny flavor of Vert.x.
package blog.rasvi.io.tomcat.vte;

import io.vertx.core.http.Http2Settings;
import io.vertx.core.http.HttpServerOptions;
import io.vertx.mutiny.core.Vertx;
import io.vertx.mutiny.core.http.HttpServerResponse;
import java.time.Duration;

public class TempRunner {

    public static void main(String[] args) throws Exception {
        var vertx = Vertx.vertx();
        var ops = new HttpServerOptions();
        var h2 = new Http2Settings();
        h2.setMaxConcurrentStreams(200_000);
        ops.setInitialSettings(h2);

        var server = vertx.createHttpServer(ops);
        server.requestHandler(request -> {
            Thread.ofVirtual().start(() -> {
                try {
                    Thread.sleep(Duration.ofSeconds(10));
                } catch (Exception ex) {
                    throw new RuntimeException(ex.toString());
                }
                HttpServerResponse response = request.response();
                response.endAndForget("Hello World!");
            });
        });

        server.listenAndAwait(8080);
    }
}
25k Connections, 10s sleep - Vertx Web
$ wrk -t 25 -c 25000 -d 15s --timeout 15s http://127.0.0.1:8080/
Running 15s test @ http://127.0.0.1:8080/
25 threads and 25000 connections
Thread Stats   Avg      Stdev     Max   +/- Stdev
    Latency    10.79s   192.11ms  11.02s    72.64%
    Req/Sec     1.88k     1.80k    6.56k    57.14%
25000 requests in 15.10s, 1.22MB read
Requests/sec:   1655.68
Transfer/sec:     82.46KB
As you can see the benchmark ran fine, but whats unexpected is the memory usage.
250MB to handle 25k HTTP connections. With -Xmx300m, the max RSS is down to 484MB. This is unreal. I had to increment a counter inside the handler to verify if it actually dispatches that many requests. Yes I counted 25k requests dispatching on the server. Comparing RSS value of Vert.x's 484MB to Axum's 537MB, I hereby declare Java uses less memory than Rust in this scenario :).
It is worth mentioning that there might be optimizations that can be done in Rust, or perhaps there are other Rust frameworks that can perform better than Vert.x. The primary goal here is not optimization or prove what is efficient, but rather to observe how the framework/language handles threads when the code is written without any intent for optimization or performance profiling. The Rust comparison is simply used as a reference to evaluate the effectiveness of Java's virtual threads :).